CPU Section
The CPU’s section is responsible for showing information about your use of the processor’s resources.
Firstly, it’s needed to understand that, this section has many graphics correspond to:
- Rendering
- Scripts
- Physics
- Animation
- Garbage Collector
- Vsync
- Global Illumination
- UI
- Others
When your project is running, if you select the CPU usage window, at the bottom side, are shown some information about your use of resources, the name of this section showed in bottom side, is Timeline, We will talk about this at this article don’t worry. (Informations showed in Timeline not is influenced by changes to colored boxes of left side).
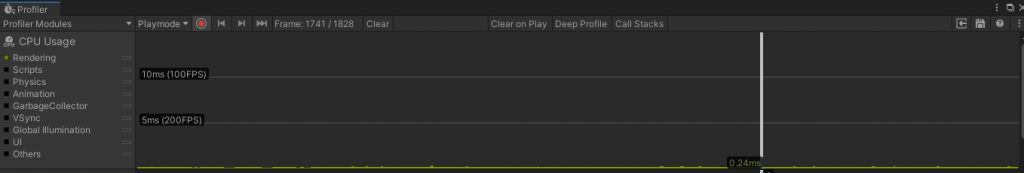
You can change the exhibition of graphics by clicking in colored boxes at the left side of the screen, this will permit that you have a vision isolated of resources’s use by each section showed in profiler, but remember that, the use of CPU by your game is a combination of use of all sections.
So let’s go to the next step.
When We click on Timeline, Unity will show a menu with three options, that are: Timeline, Hierarchy and Raw Hierarchy.
We will talk about all the options, don’t worry.
Firstly let’s start with the timeline, and after We will advance for hierarchies.
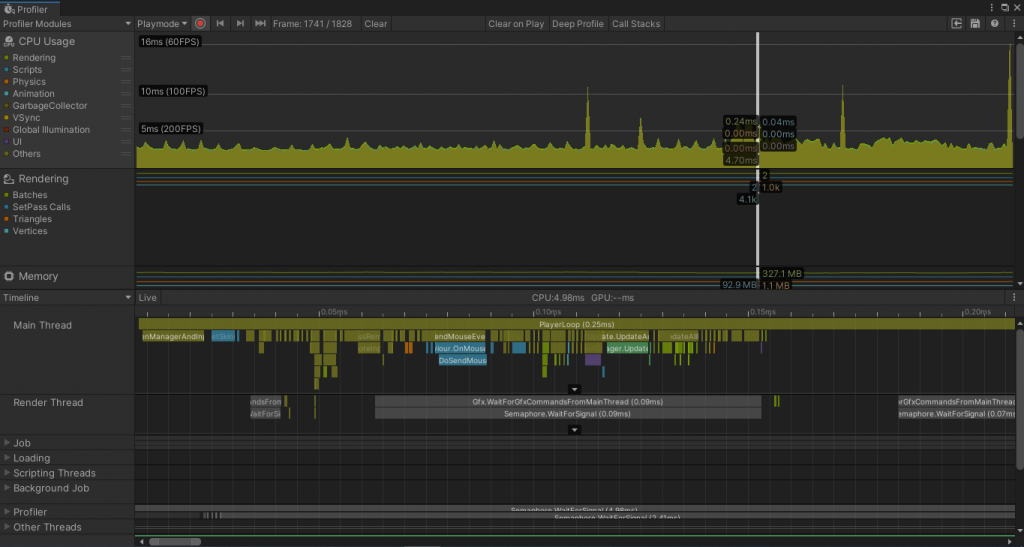
Timeline
The timeline mode shows information about the resources’s use in all threads. Your information is shown by rectangles that represent the processes that are running and the time spent to complete each process.
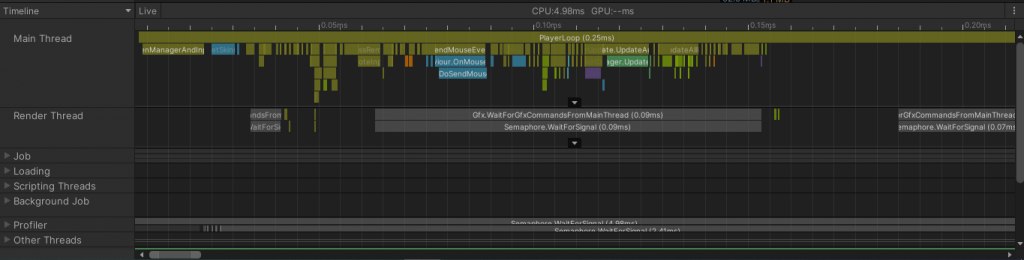
For to simplify, how bigger the rectangle, bigger is the time in execution of a task, and bigger your costs of CPU, in this case you for optimize your game, you need reduce the rectangles for consequently reduce the execution’s time of tasks and gain more performance.
The CPU Impact directly in the FPS of your game, so is necessary a special caution. Remember that a process of optimization is constant and requires many analizes.
Now that we talked about Timeline Mode, let’s go to talk about Hierarchies.
Unity has two modes of hierarchies in profiler, they are: Hierarchy and Raw Hierarchy.
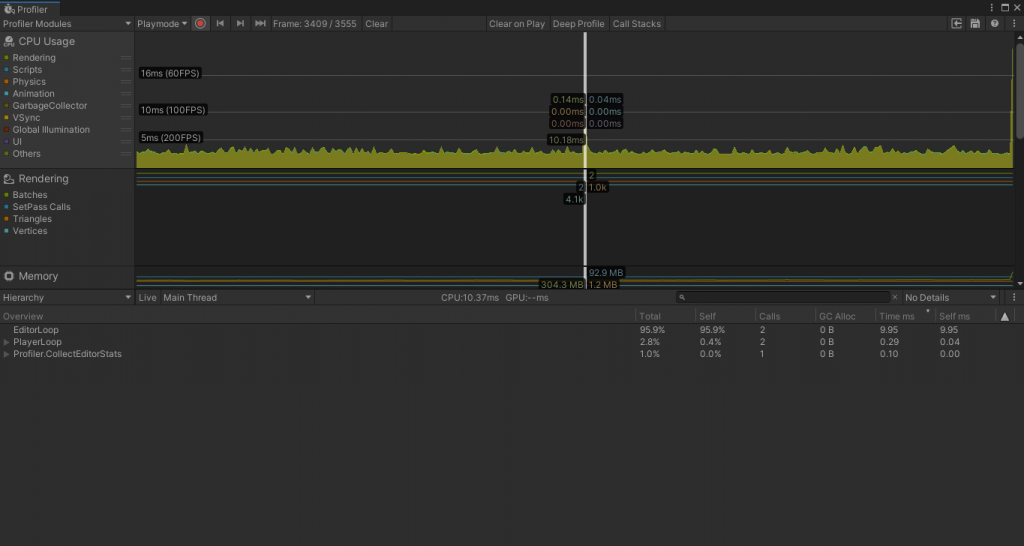
Hierarchy
The Unity’s Documentation says that:
- Hierarchy mode groups all information of processes.
You can see more details in documentation with this link: https://docs.unity3d.com/Manual/ProfilerCPU.html
In hierarchy mode all infos about processes created are grouped as mentioned above. So it is not possible to have two EditorLoops, or two PlayerLoops.
With hierarchy mode you can see in percentage the use of your resources, you also can see which process is using more CPU in percentage, this makes it easier to understand where is necessary to optimize.
Is important note that EditorLoop and PlayerLoop contains an arrow of left side, this means that, They have hierarchies, openning these hierarchies, you can see the processes related to them, with your CPU’s use in percentage, in this way, is possible to monitor which processes is using more resources.
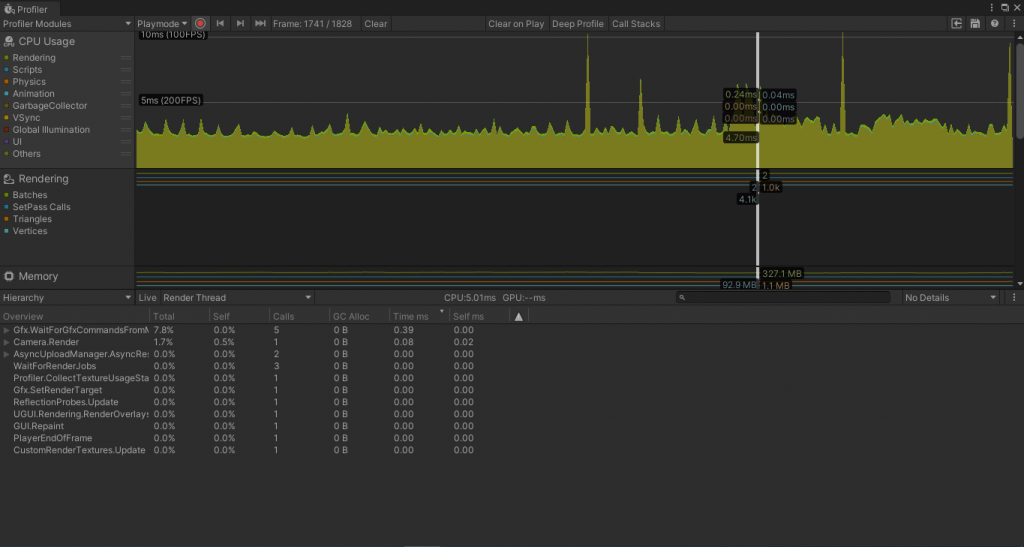
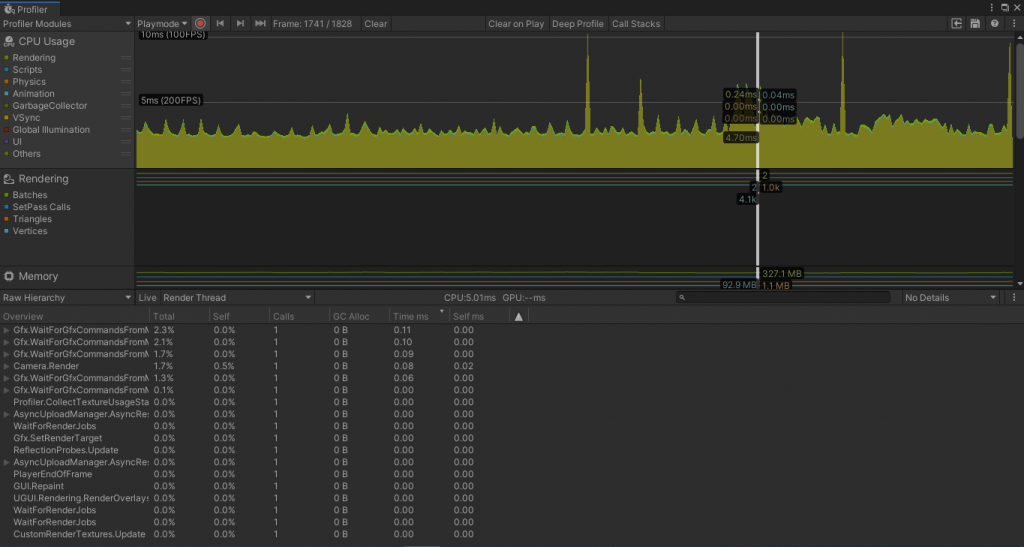
Also is possible to verify resource’s use in other threads besides the main, you only need click in Main Thread, after this, Unity will show a menu for you, in this menu you can select the thread, so Unity will show the process running at this thread.
You can see this in the example image.
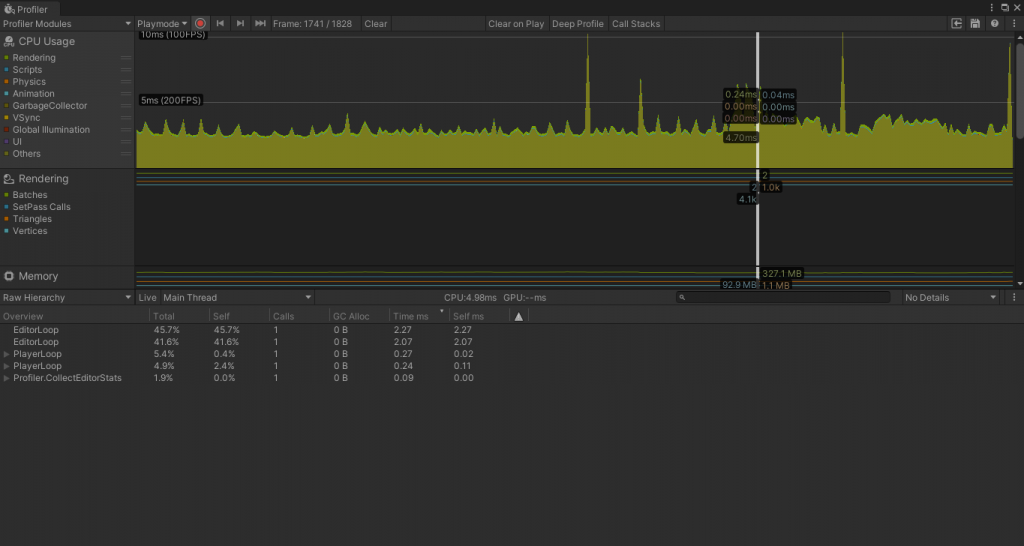
Hierarchy and Raw Hierarchy work in the same form, the difference is that, in Hierarchy the processes are grouped, while in Raw Hierarchy, groups are not created, so you can have repetitions of things as PlayerLoop, Editor Loop, and others.
You can see this in the image bellow.
Here also is possible verify another threads, as you can see in the next image.
MAKING CPU ANALYZING
For to make a CPU analysis you must see the graphics of CPU usage constantly, is important analyze the maximum of informations possible, for this you can navigate in between graphics, these graphics will help you to find peaks where your CPU is more used, select these peaks and see the informations at bottom side, through of Timeline or Hierarchies, remember that, is very important analyze the time used for each task, and percentage of use of CPU, because with this you can identify problems easily, and consequently fix the problem more fast.
I recommend that this analysis be done with a frequency, because optimization is very important process.
So at this article you understand about the CPU section in profiler, you can see the Unity’s official documentation for more details by the link https://docs.unity3d.com/Manual/ProfilerCPU.html
You can see my other articles about optimization, where I talk about Introduction to Optimization, and Memory Section Of Profiler.
Follow-me on Instagram for stay knowing when I create new posts.
You can also leave your feedback, and your suggestion, I will read all, and I will answer for you.
Thank you for reading.