Memory Section
Memory Section, is responsible for to show all informations about your memory use, it is important to mention that she has visual and written information.
The visual information is showed together with others profiler graphics, in memory’s case, is a graphic of lines.
The writted information is showed in bottom side, and this can to be showed of two forms, detailed and simple, in this article I will talk about this.

Now let’s talk about the Memory Graphic.
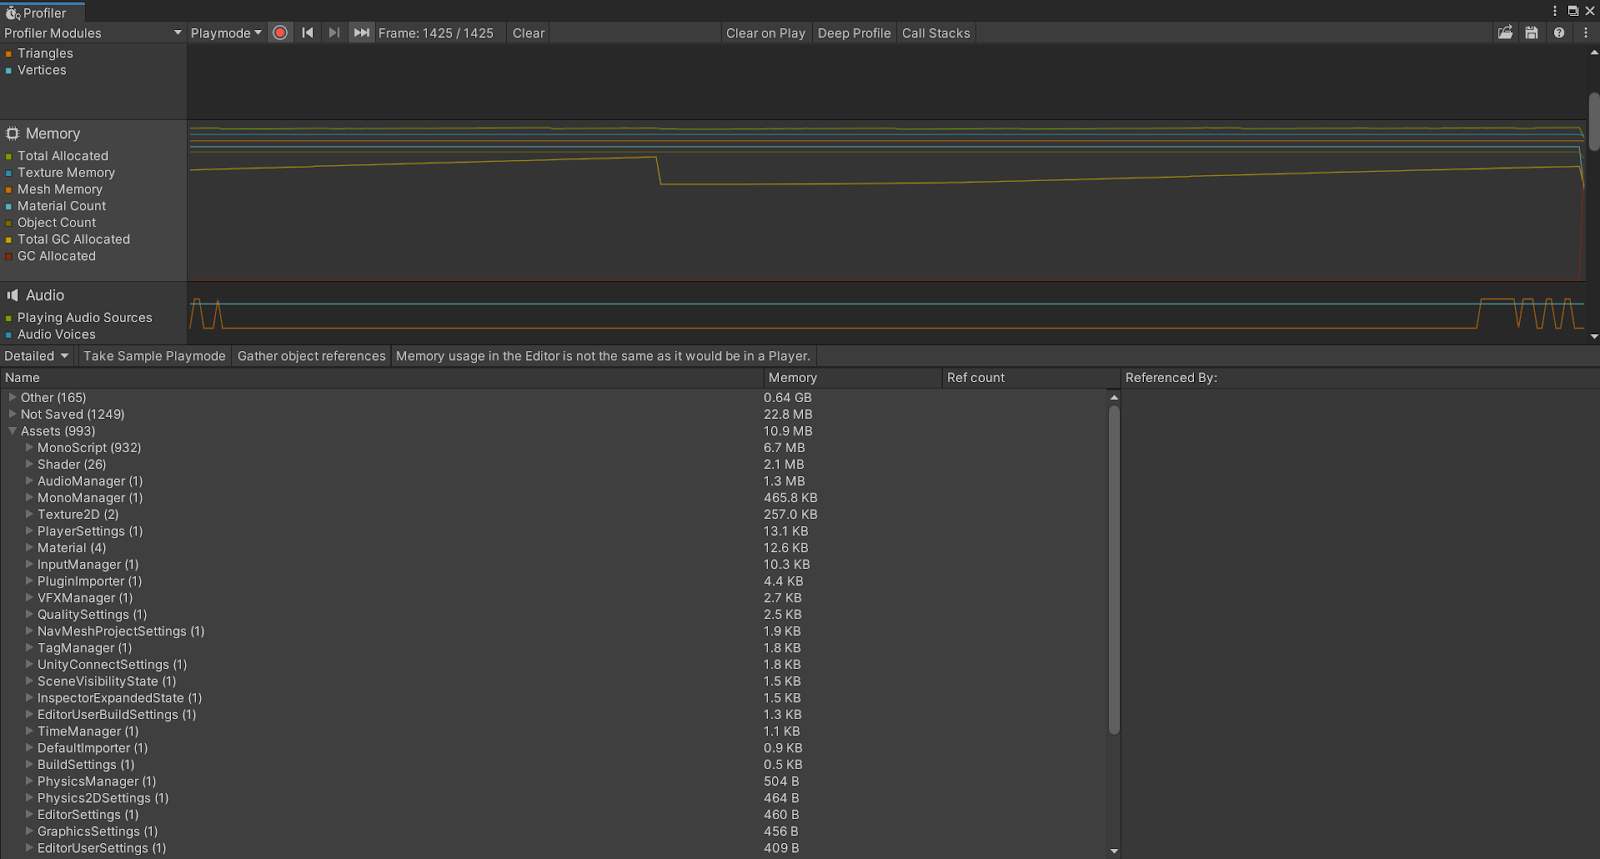
In the Memory section is possible to see many lines executing together, they correspond to:
- Total Allocated
- Texture Memory
- Mesh Memory
- Material Count
- Object Count
- Total GC Allocated
- GC Allocated
You can change the graphic’s settings. It only will show the lines correspondents to the boxes selected (colored).
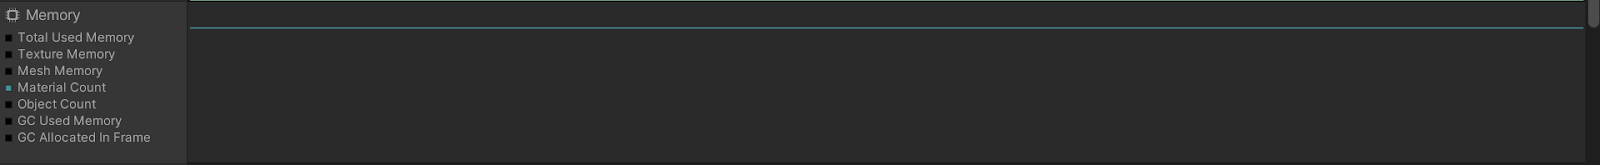
The use of this resource allows you to isolate each line, and this can be very useful when you need clarity of visual information, it is noteworthy that changing the options on the chart does not influence the display of information that is written on the bottom side of window.
EXPLAINING THE WINDOW MEMORY
The graphic allows you to see it informations frame by frame.
Your informations will be showed with more details at bottom side.
Here the profiler is configured in a simple way, so we will see all in a simplified way.
In bottom side is your memory usage with more details, note that you have usage information in Bytes, KBs, MBs and GBs, also note that you have information about the number of objects in the selected frame. In other words, here you have the basics of memory information.

But this is not all, if you click at Simple and to change the form of exhibition for detailed, clicking at Take Sample, you can see infos detailed, about all use of memory.
See the images below.


With hierarchy openned, you can click in a line, and case your file is in a valid folder, Unity will find for you, and he will be showed in your project.
This is a way for to find quickly your file that needs to improvement.
See example below.

At this article you understood about the memory section in profiler, you can see the Unity’s official documentation for more details here.
Follow-me on instagram for stay knowing about new posts.
You can also leave your feedback, and your suggestion, I will read all, and I will answer for you.
Thank you for reading.
Leave a Reply